Market Insights
St. John Sales History
Explore historical real estate data and market trends across the island, from residential homes to luxury land parcels and charming condominiums.
Total Sales Volume ($)
Market Trend
Total Properties Sold
Inventory Flow
Detailed Year-over-Year Data
Raw aggregate performance metrics for Homes
| Year | Sold | Low | High | Average | Total Volume |
|---|---|---|---|---|---|
| 2025 | 48 | $255,000 | $10,500,000 | $5,377,500 | $78,302,500 |
| 2024 | 38 | $365,000 | $8,200,000 | $2,012,829 | $76,487,500 |
| 2023 | 43 | $185,000 | $6,202,625 | $1,799,201 | $77,365,625 |
| 2022 | 80 | $180,000 | $9,700,000 | $1,561,468 | $124,917,425 |
| 2021 | 116 | $310,800 | $8,000,000 | $1,763,423 | $204,557,000 |
| 2020 | 51 | $235,000 | $5,400,000 | $1,216,419 | $62,037,354 |
| 2019 | 45 | $250,000 | $9,000,000 | $1,169,878 | $52,644,500 |
| 2018 | 60 | $107,500 | $3,795,000 | $1,049,483 | $62,969,000 |
| 2017 | 38 | $225,000 | $3,600,000 | $891,763 | $33,886,999 |
| 2016 | 53 | $115,000 | $3,025,000 | $1,041,606 | $55,205,109 |
| 2015 | 38 | $189,000 | $4,000,000 | $1,074,847 | $40,844,200 |
| 2014 | 38 | $145,000 | $7,750,000 | $1,080,381 | $41,054,462 |
| 2013 | 48 | $165,000 | $3,500,000 | $1,054,698 | $50,625,500 |
| 2012 | 28 | $325,000 | $8,450,000 | $1,183,607 | $33,141,000 |
| 2011 | 27 | $135,000 | $12,000,000 | $1,722,222 | $46,500,000 |
| 2010 | 20 | $420,000 | $3,000,000 | $1,285,075 | $25,701,500 |
| 2009 | 22 | $240,000 | $6,500,000 | $1,283,182 | $28,230,000 |
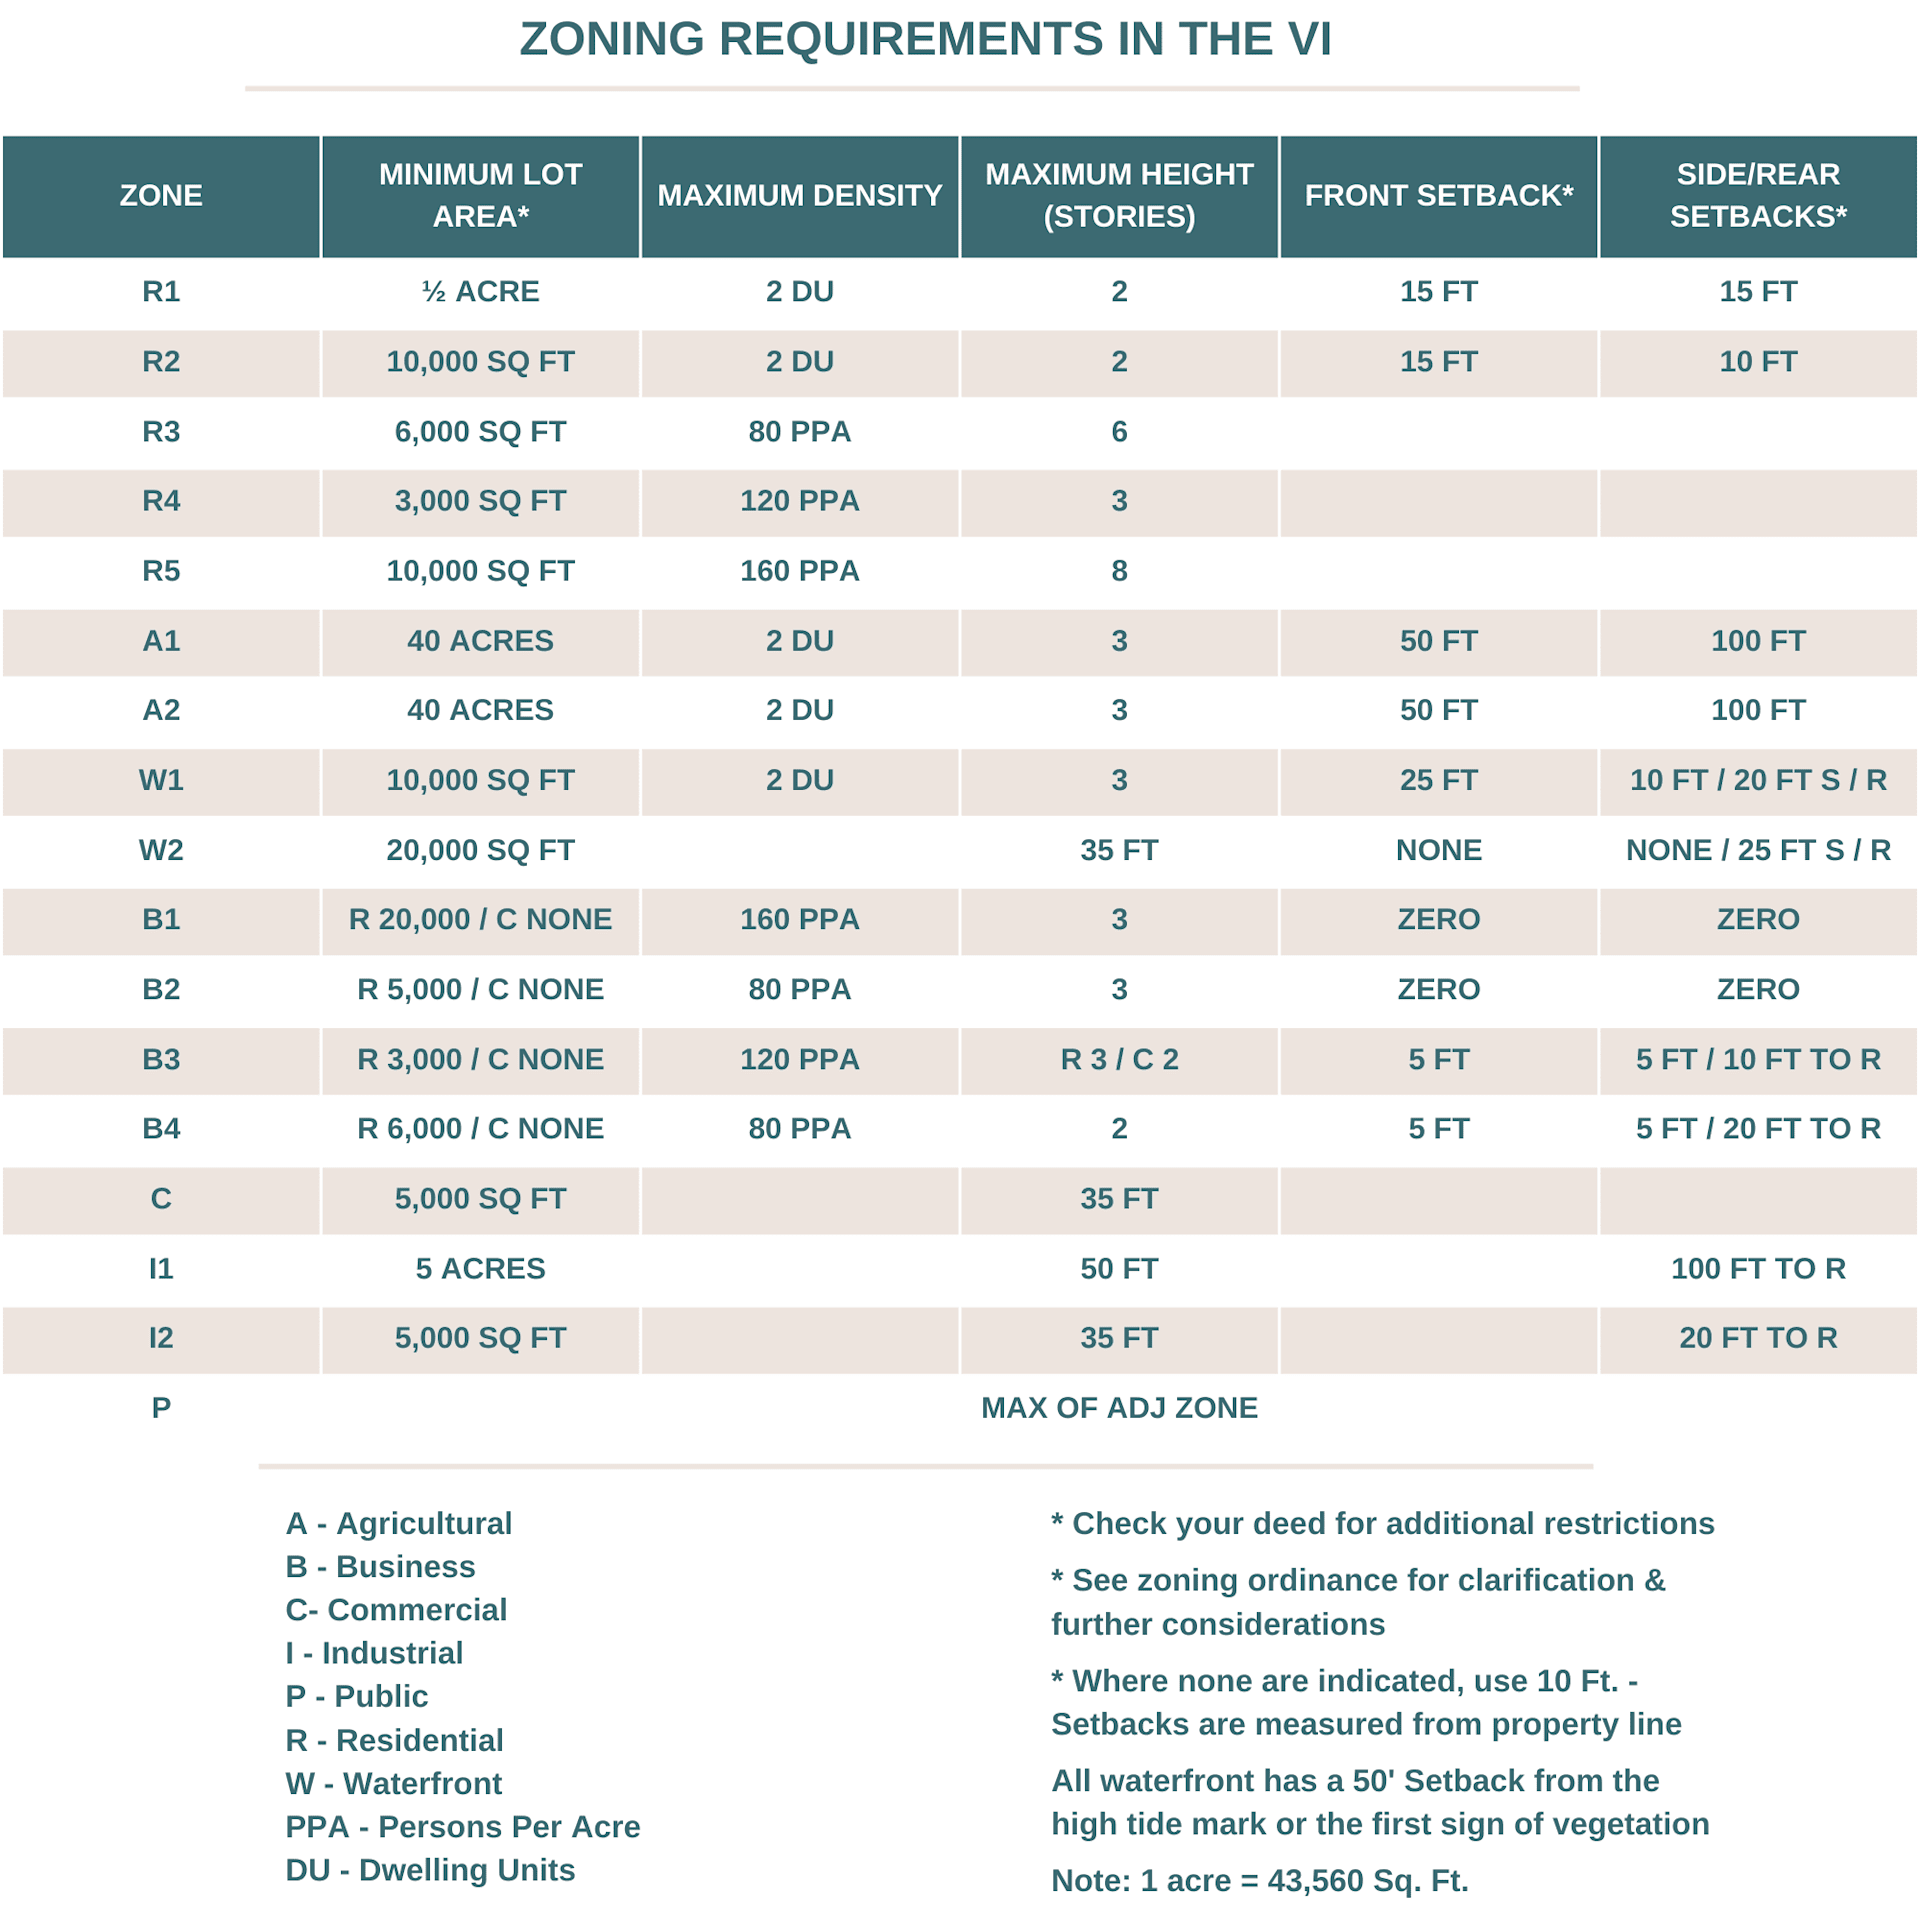
Zoning Requirements in the VI